


The COVID-19 vaccine increased the infection rate, the case fatality rate trend, and the long-term all-cause mortality

Analyses from 39 countries with over a billion people show that the COVID-19 vaccine increased the infection rate, the case fatality rate trend, and the long-term all-cause mortality, yet it had no substantial preventive effects concerning reductions in COVID-19-related deaths in any period.
Infection rate
Over three years, analyses from 39 countries with over a billion people show that (1), except for the last part of 2021, the number of COVID-19 infections per million was most prevalent in high-vaccination countries, particularly at the beginning of 2022 (Figure 1). The high prevalence in the high-vaccination countries coincided with an overall strong increase in COVID-19 infections during that period (2). An implication is that the COVID-19 vaccine increased the infection rate, not the opposite, and aligns with the immune escape theory and research showing 251 times higher virus load among vaccinated than unvaccinated.
Figure 1.

Regression analysis with 95 percent confidence intervals shows weekly associations between COVID-19 vaccination doses per 100 (log-transformed using the natural logarithm) with a week lag and COVID-19 cases per one million.
Case fatality rate
On the other hand, the case fatality rate for a relatively extended period between mid-2021 and mid-2022 was lowest in high-vaccination countries (Figure 2), but an increasing trend indicates a decreasing immunity there (3).
Figure 2.
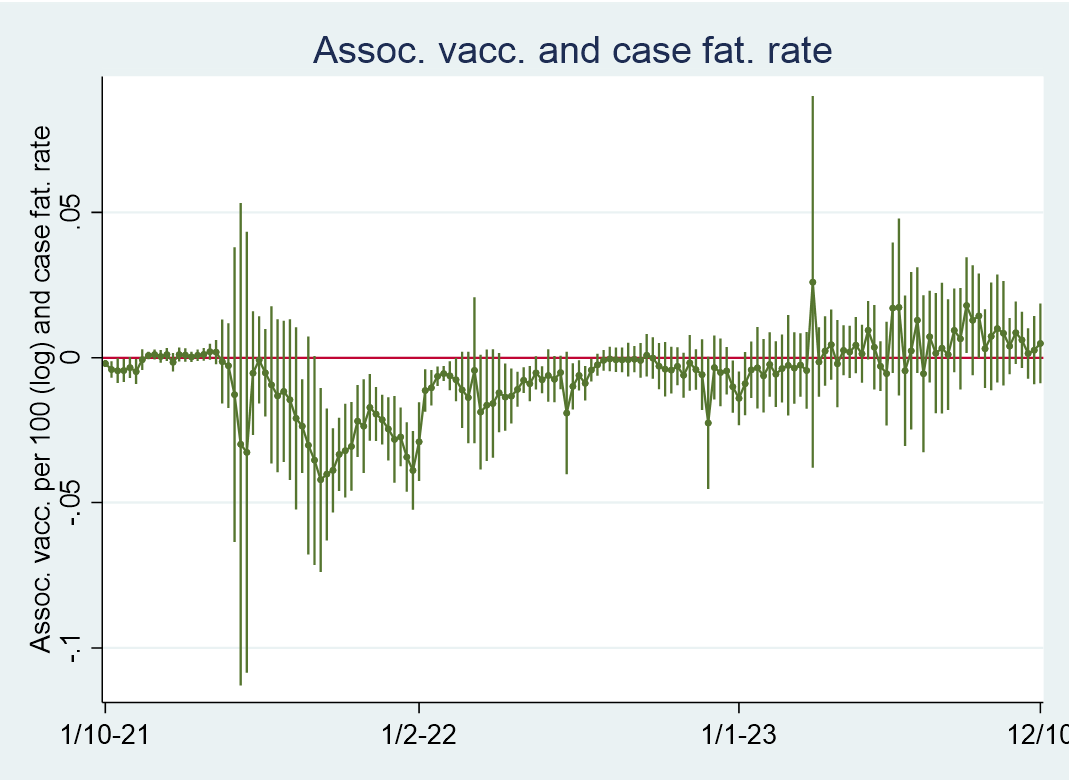
Regression analysis with 95 percent confidence intervals showing weekly associations between COVID-19 vaccination doses per 100 (log-transformed using the natural logarithm) with a week lag and case fatality rates per one million. Fatalities are modeled with a three-week lead relative to cases.
Deaths per million
Similar to the case fatality rate, COVID-19 deaths per million were lowest in high-vaccination countries between mid-2021 and mid-2022 (Figure 3), which may indicate temporary protection (4).
Figure 3.

Regression analysis with 95 percent confidence intervals shows weekly associations between COVID-19 vaccination doses per 100 (log-transformed using the natural logarithm with a week lag) and COVID-19 deaths per one million.
COVID-19 vs. non-COVID-19 excess mortality
However, Figure 4 shows that the excess mortality concerning COVID-19 deaths vs. non-COVID deaths, marked in magenta color, substantially revealed no vaccine protection during that period (5). A further issue to consider is that excess mortality concerning COVID-19 deaths vs. non-COVID deaths was conservatively measured as COVID-19 deaths have been overreported. Thus, solely emphasizing either per-capita COVID-19 deaths (Figure 3) or all-cause excess mortality (Figure 4, marked in orange color) can mistakenly indicate temporal vaccine protection, which is not substantially the case (6).
Figure 4.
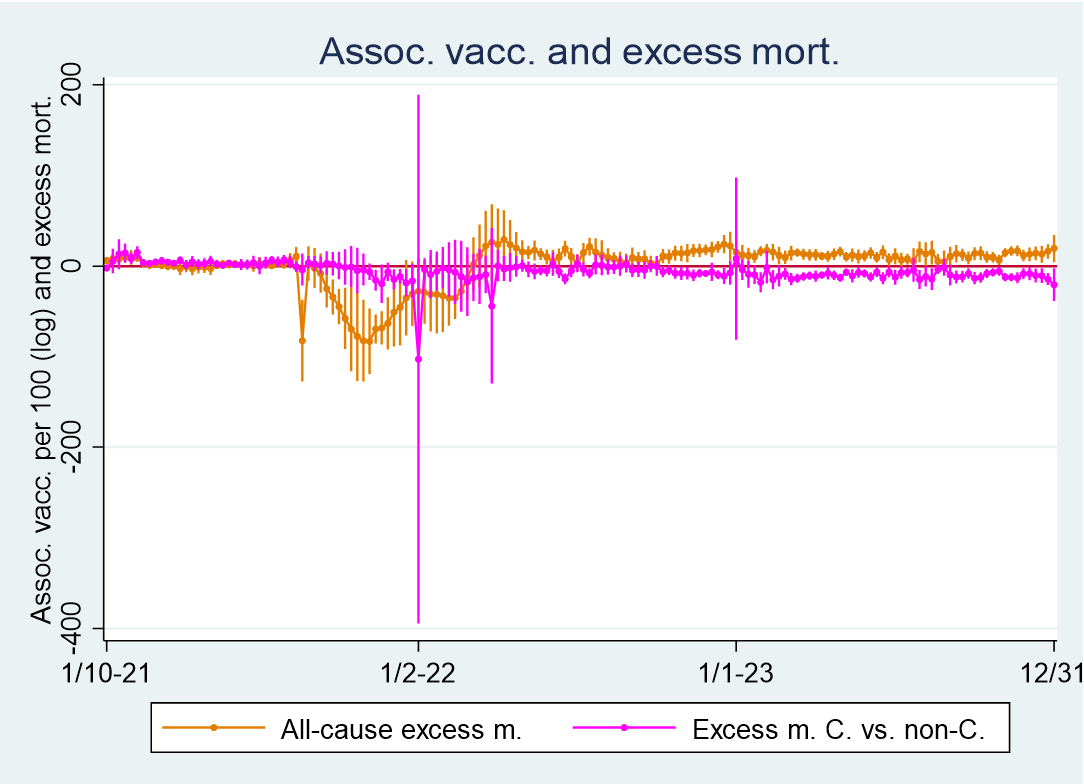
Regression analysis with 95 percent confidence intervals shows weekly associations between COVID-19 vaccination doses per 100 (log-transformed using the natural logarithm) with a week lag and excess mortality. All-cause excess mortality is reported in orange, and excess mortality related to COVID-19 vs. non-COVID-19 is reported in magenta color.
Conclusion
Since the COVID-19 vaccine uptake leveled off in February-March 2022, it has had a strong long-term consistent effect on all-cause mortality, I have previously shown, and the findings are replicated here in Figure 5. Hence, the analyses induce the following conclusions: The COVID-19 vaccine increased the infection rate, the case fatality rate trend, and the long-term all-cause mortality, yet it had no substantial preventive effects concerning reductions in COVID-19-related deaths in any period.
Figure 5.

Association between average all-cause excess mortality and average COVID-19 vaccination doses per 100 with a week lag from March 6, 2022, to the end of 2023.
Notes
1. The countries are the same as those I analyzed here using the same data source, Our World in Data, and reporting weekly data. COVID-19 cases per million were weekly averages.The independent variable throughout the analyses, also used here, is vaccination rates per 100 inhabitants. It is log-transformed with a week lag. Log-transformation means that if the y-axis shows 1000, a one percent increase in vaccination rate is associated with approximately 10 more cases per million. Using robust regression with cluster-adjusted error terms, all analyses are weighted for each country’s population size, and further details can be found here. Concerning the data shown in Figure 1, I controlled for the human development index in an unreported analysis, as relatively rich countries may report relatively many cases due to better testing facilities, but without altering any conclusion. Also, I replicated the analysis by using a four-week lag concerning the independent variable, which neither altered any statistical conclusion.
2. The blue line in Figure N1 below illustrates the descriptive statistics concerning cases per million. Moreover, it illustrates the descriptive statistics concerning the case fatality rate and COVID-19 deaths per million to be addressed. The olive line in Figure N2 illustrates descriptive statistics concerning the COVID-19 vaccination rate. In addition, it illustrates descriptive statistics concerning excess mortality related to COVID-19 deaths vs. non-COVID deaths and all-cause excess mortality, which are to be addressed.
Figure N1.

Descriptive statistics (i). Deaths per million are modeled with a three-week lead.
Figure N2.

Descriptive statistics (ii). Vaccination doses per 100 are modeled with a week lag.
3. The case fatality rate was measured as the average weekly number of COVID-19 deaths per million divided by the average weekly average number of cases. The average weekly number of COVID-19 deaths per million was modeled with a three-week lead, as research has shown a median period of 18.5 days from infection to death. I have noted that descriptive statistics concerning the case fatality rate are illustrated in Figure N1.
4. Also, I replicated the analyses by inducing a four-week lag concerning the independent variable, which neither altered any statistical conclusion. I have noted that descriptive statistics concerning COVID-19 deaths per million are illustrated in Figure N1.
5. Excess mortality concerning COVID-19 deaths vs. non-COVID deaths (a) was modeled as follows: a= (((100+b*(c/d))/(100+b*((d-c)/d)))-1)*100, where b is weekly all-cause excess mortality in percent, c is average weekly number of COVID-19 deaths per million, and d is weekly changes in cumulative excess mortality per million. I replicated the analyses by inducing a four-week lag concerning the independent variable, which neither altered any statistical conclusion. I have noted that descriptive statistics concerning excess mortality related to COVID-19 deaths vs. non-COVID deaths are illustrated in Figure N2.
6. In the latter part of the period, the associations between the COVID-19 vaccination uptake and COVID-19 deaths vs. non-COVID deaths are mostly significantly negative. The reason is the strong positive association between the COVID-19 vaccination uptake and non-COVID deaths, shown here. I have noted that descriptive statistics concerning all-cause excess mortality are illustrated in Figure N2, and further details concerning the variable can be found here.